DevTools: inspect the page you are building
Rask DevTools is a panel inside the page you are working on. It shows what the page and the app say to each other, which components the page is made of and what each one was given, which of them render and why, and where each interaction's time goes. It is there while you develop and gone from what you ship.
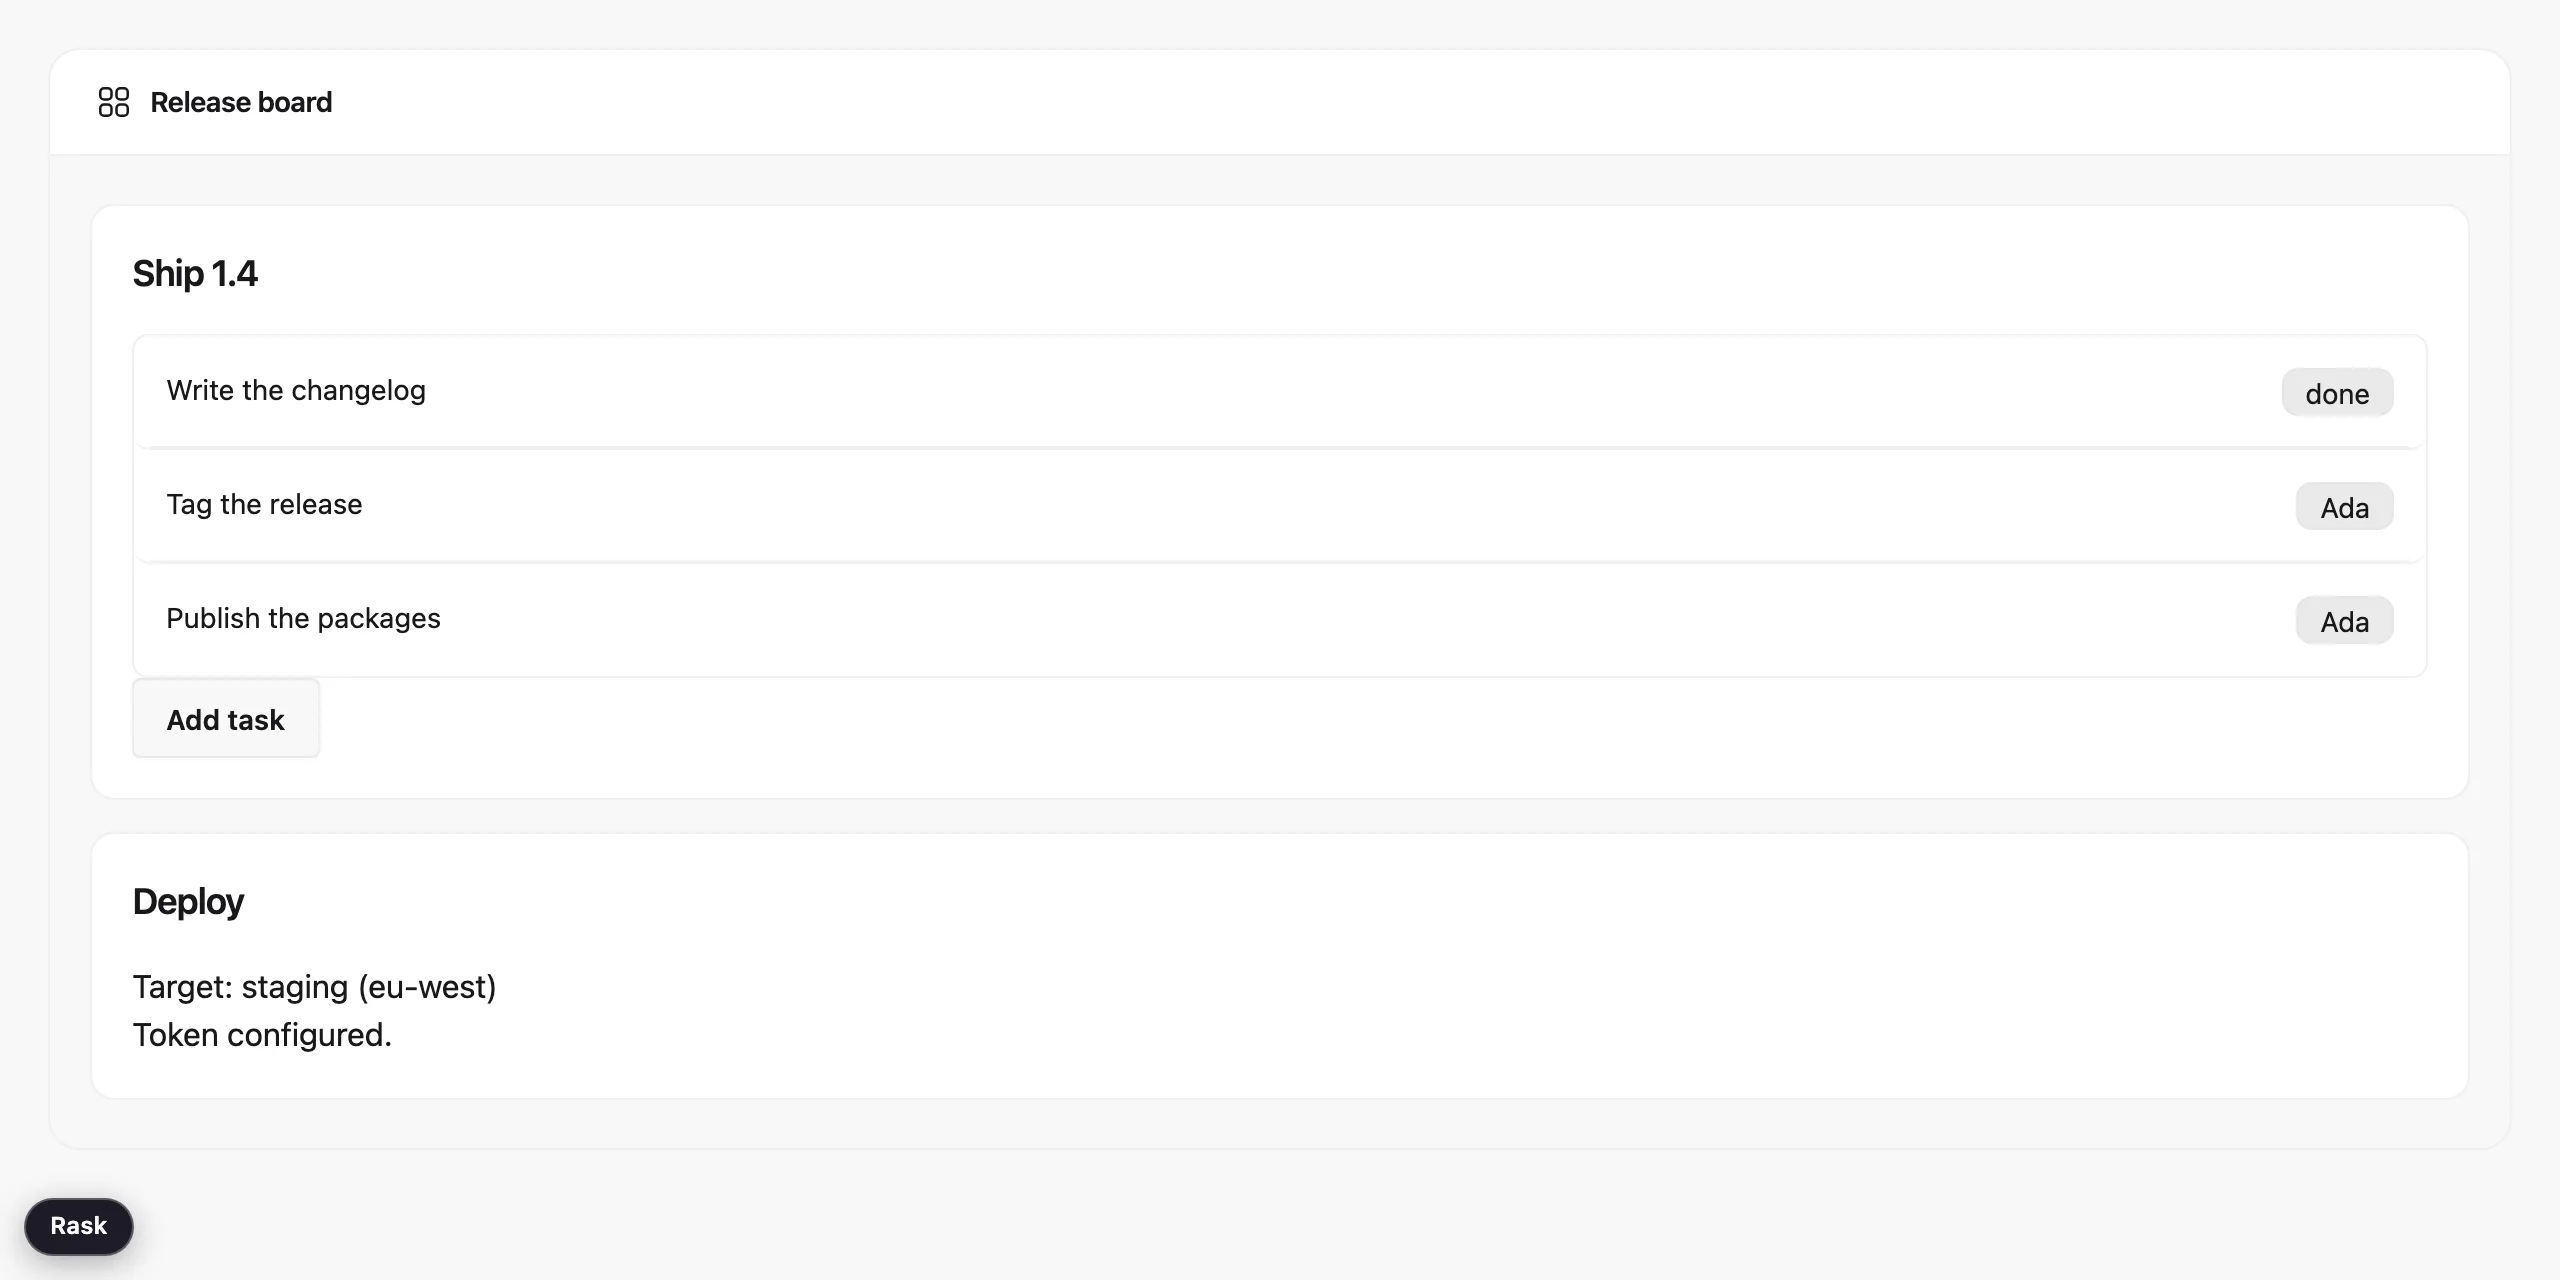
Turning it on
An app made with rask new already has it. Run the app from a Debug build and the Rask pill is in the page's
bottom-left corner. Click it, or press Ctrl+Shift+D (Cmd+Shift+D on a Mac), and the panel opens.
An existing app adds the package. The panel is drawn with the UI kit, so the app references that too:
dotnet add package Rask.DevTools
dotnet add package Rask.Ui
An app without the kit keeps running without the pill. On a Server host it logs a warning at startup naming the package to add.
The panel appears only when all of these hold:
| Host | When the panel is on |
|---|---|
| Server | A Debug build, the Development environment, and a browser on the same machine as the app. |
| WASM | A Debug build, and a page served from localhost or another loopback address. |
A development server you reach from another machine refuses the panel. Set RASK_DEVTOOLS_ALLOW_REMOTE=1 in the
app's environment to allow it. Each panel is also tied to the page that opened it, and to the signed-in user who
opened that page.
Nothing of it ships
RaskDevTools is true in a Debug build and false in every other. When it is false, a publish leaves out the
devtools assembly, its scripts and its entry in the .deps.json. Then it checks the output, and fails the
publish if any of them is still there. Set the property yourself to decide otherwise, for example to turn the
devtools off in a Debug build:
<PropertyGroup>
  <RaskDevTools>false</RaskDevTools>
</PropertyGroup>
What a Release build of the framework keeps is a few hundred bytes of inert hooks in the page runtime. A size test pins them.
Docking
The panel opens as a drawer along the bottom of the window. Right docks it along the right edge instead, and the page remembers the choice. Close, the shortcut, or the pill hides it again. Your place in the panel stays where you left it.
Wire
Wire lists every frame the page and the app exchange: each event the page sends, and each render frame the app answers with. The totals sit on top: frames and bytes, each way.
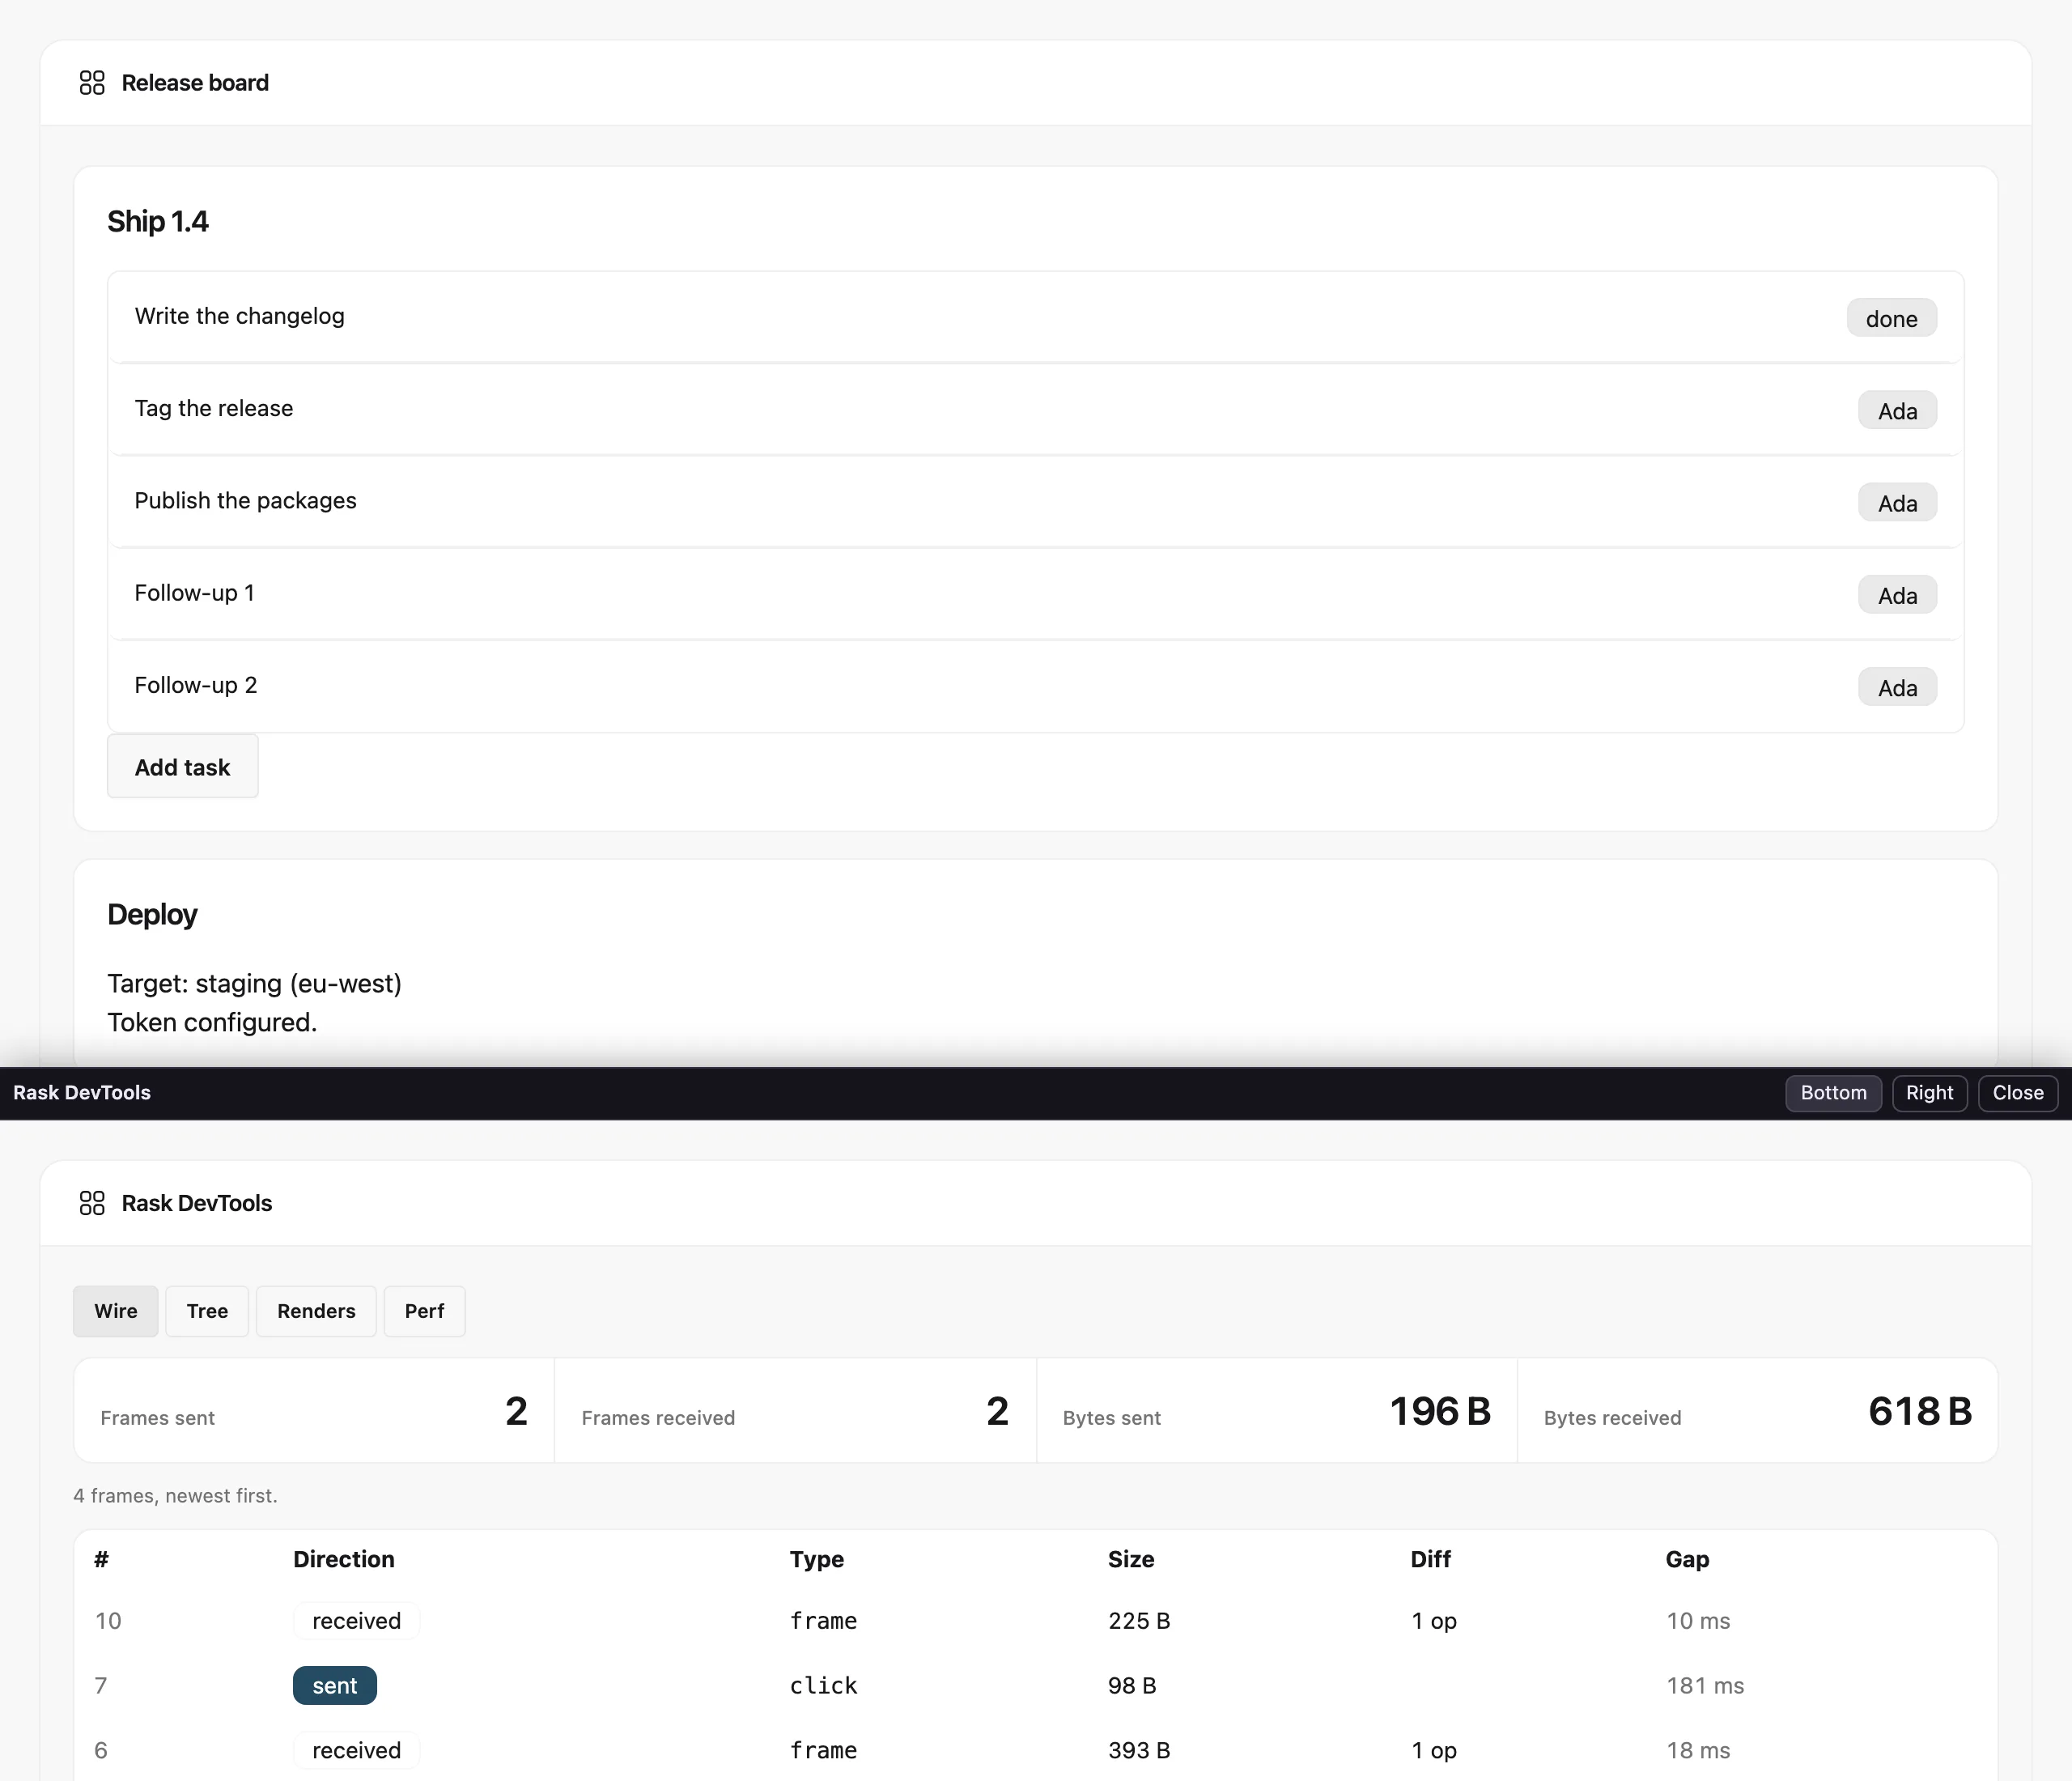
Each row shows:
- Direction: sent for what the page sent, received for what came back.
- Type: the event the page sent, such as
click, orframefor a render. - Size: the frame's size on the wire.
- Diff: for a render, how many edits it made to the page. A frame that replaced the whole document has none.
- Gap: the time since the frame before it. A round trip, or a handler that renders more often than it needs to, shows up here.
The Wire tab records only the page's own traffic. The panel's own frames never show up in it.
Tree
Tree shows the page's components nested the way they sit on the page. A card's rows sit under the card, even when the page that uses the card is the one that built them. Each row shows what its component was given:
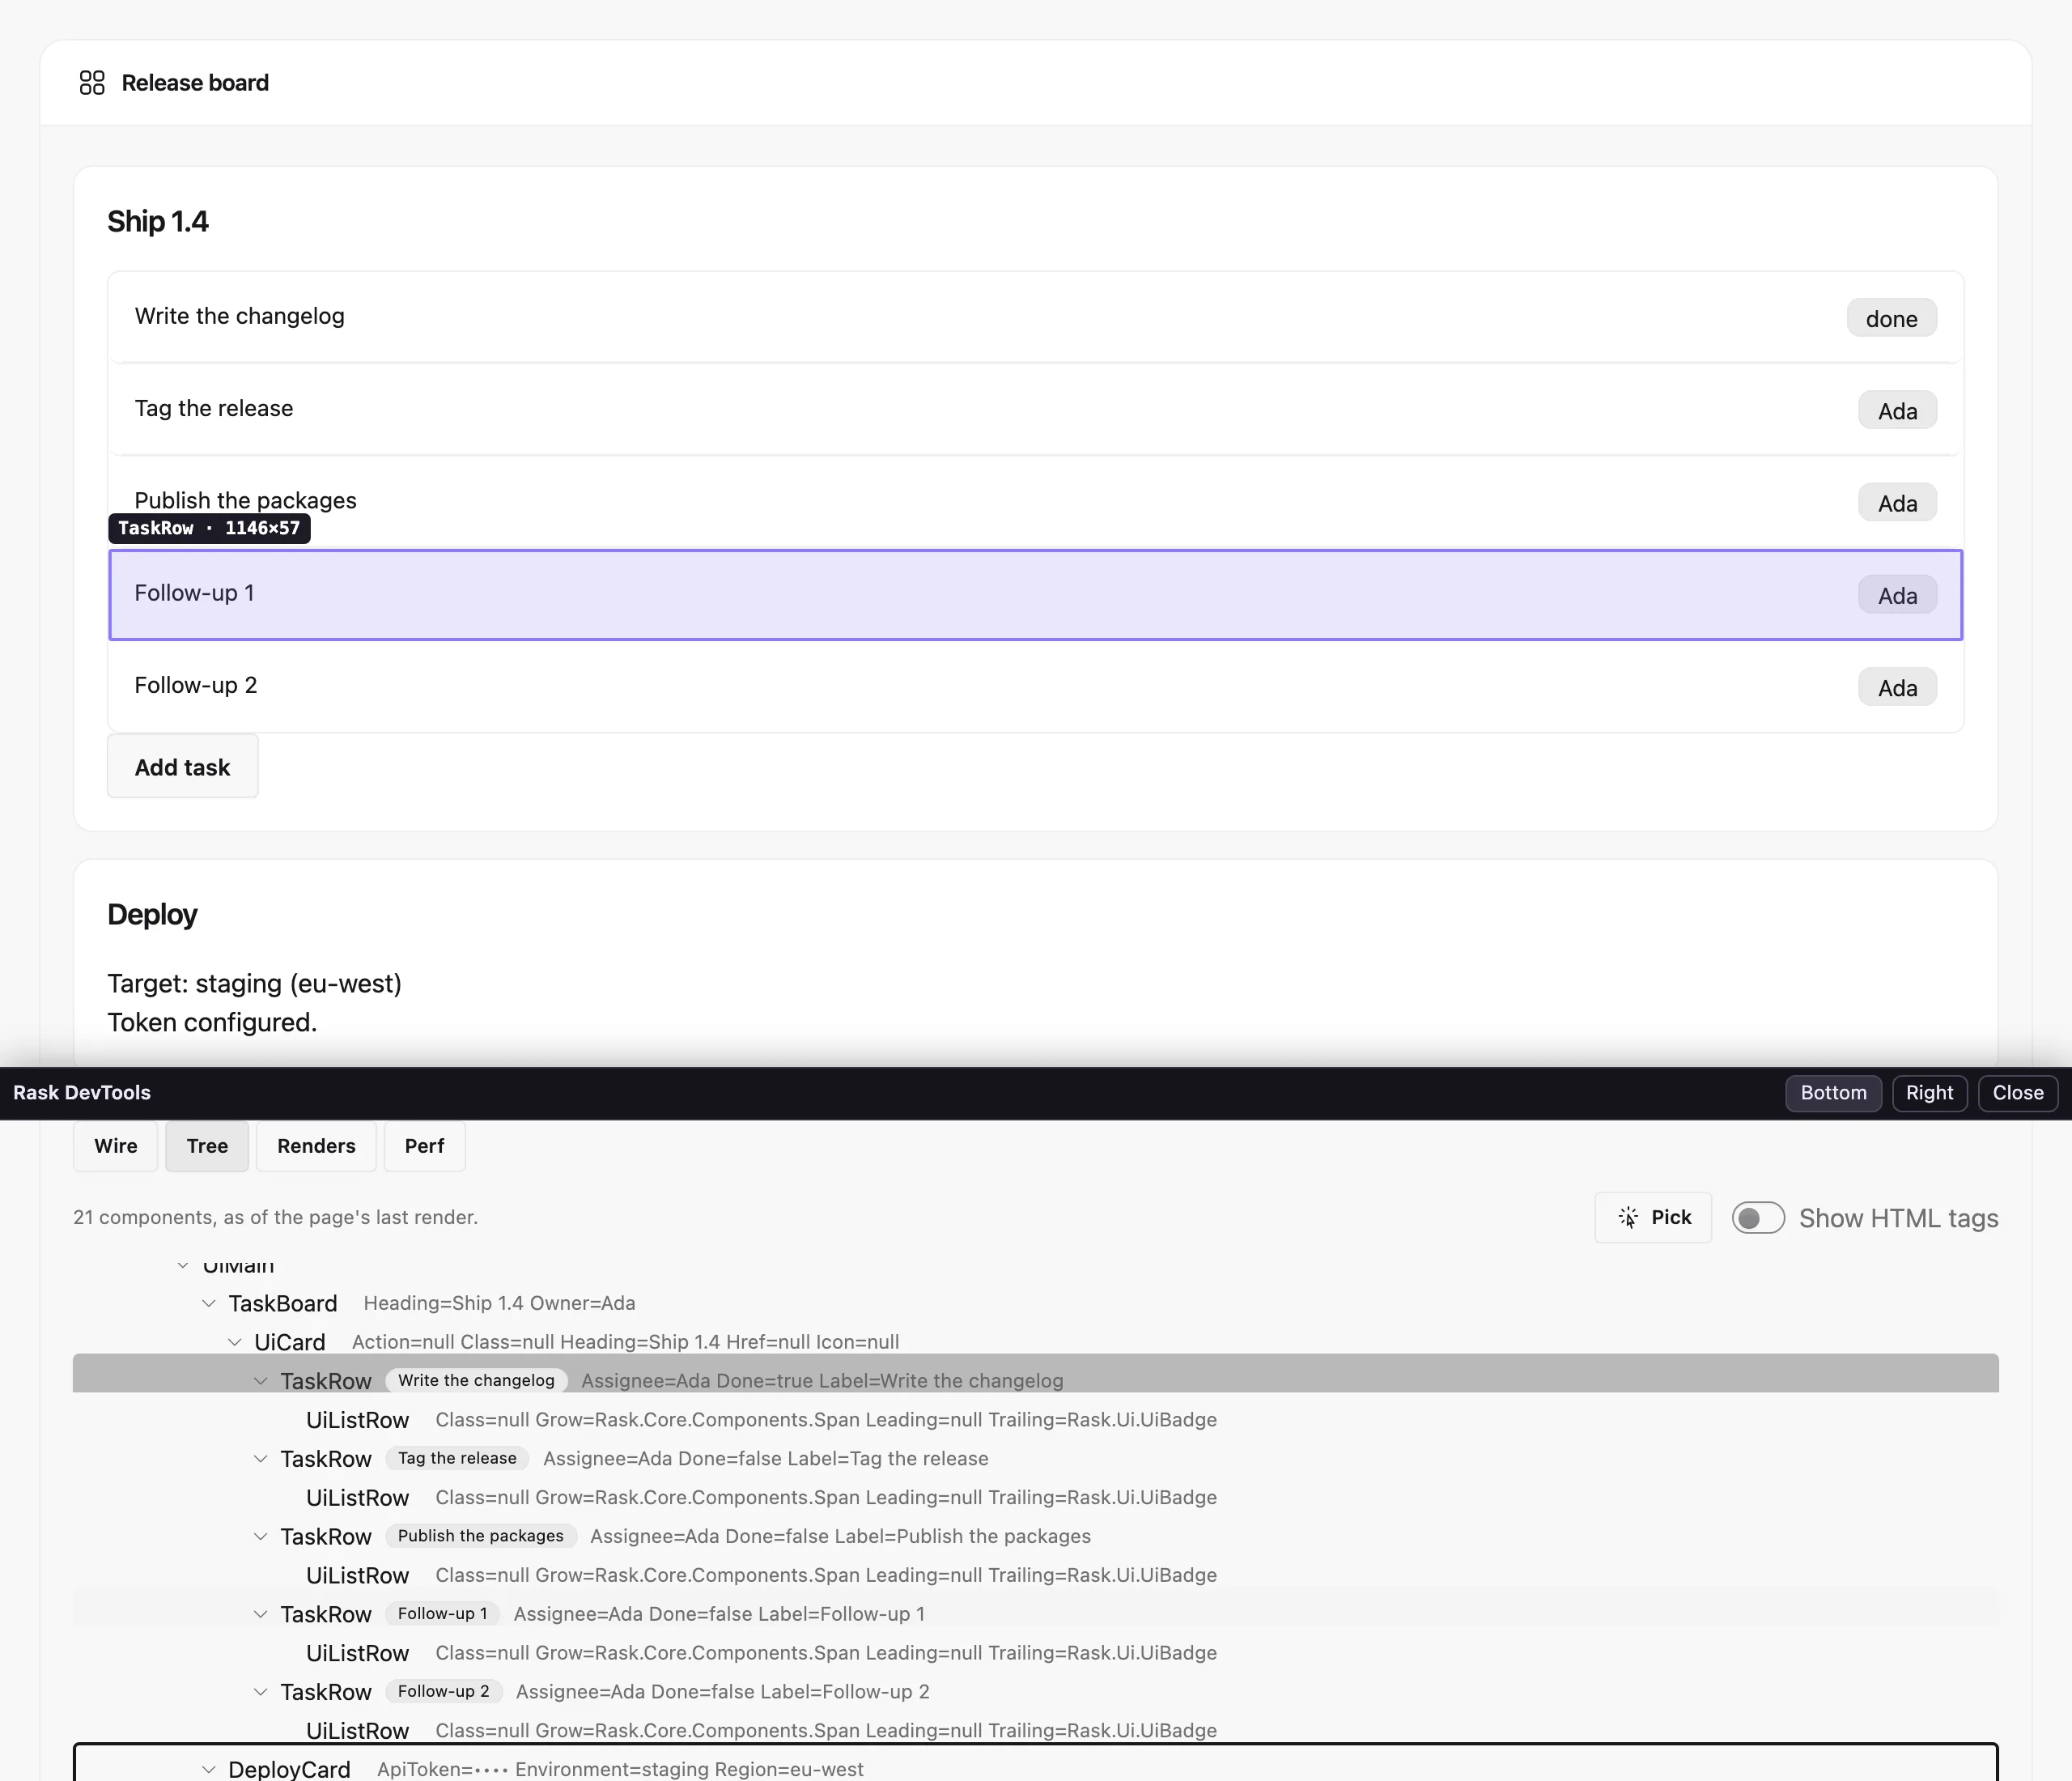
- The type, as you write it:
TaskRow,UiTree<Node, string>. - The key, as a badge, when the component has one.
- Its props, as
Name=value. Rask writes the code that reads them when it builds the app, so they are there in a trimmed WASM app too.
Show HTML tags adds the elements between the components, so you can see which <ul> a row sits in.
The tree is ready as soon as you open the tab, and it follows every render after that. Branches you open stay open while the page re-renders.
Finding a component on the page, and the page in the tree
Point at a row and the page shows where that component is: a box around everything it rendered, labelled with its name and size.
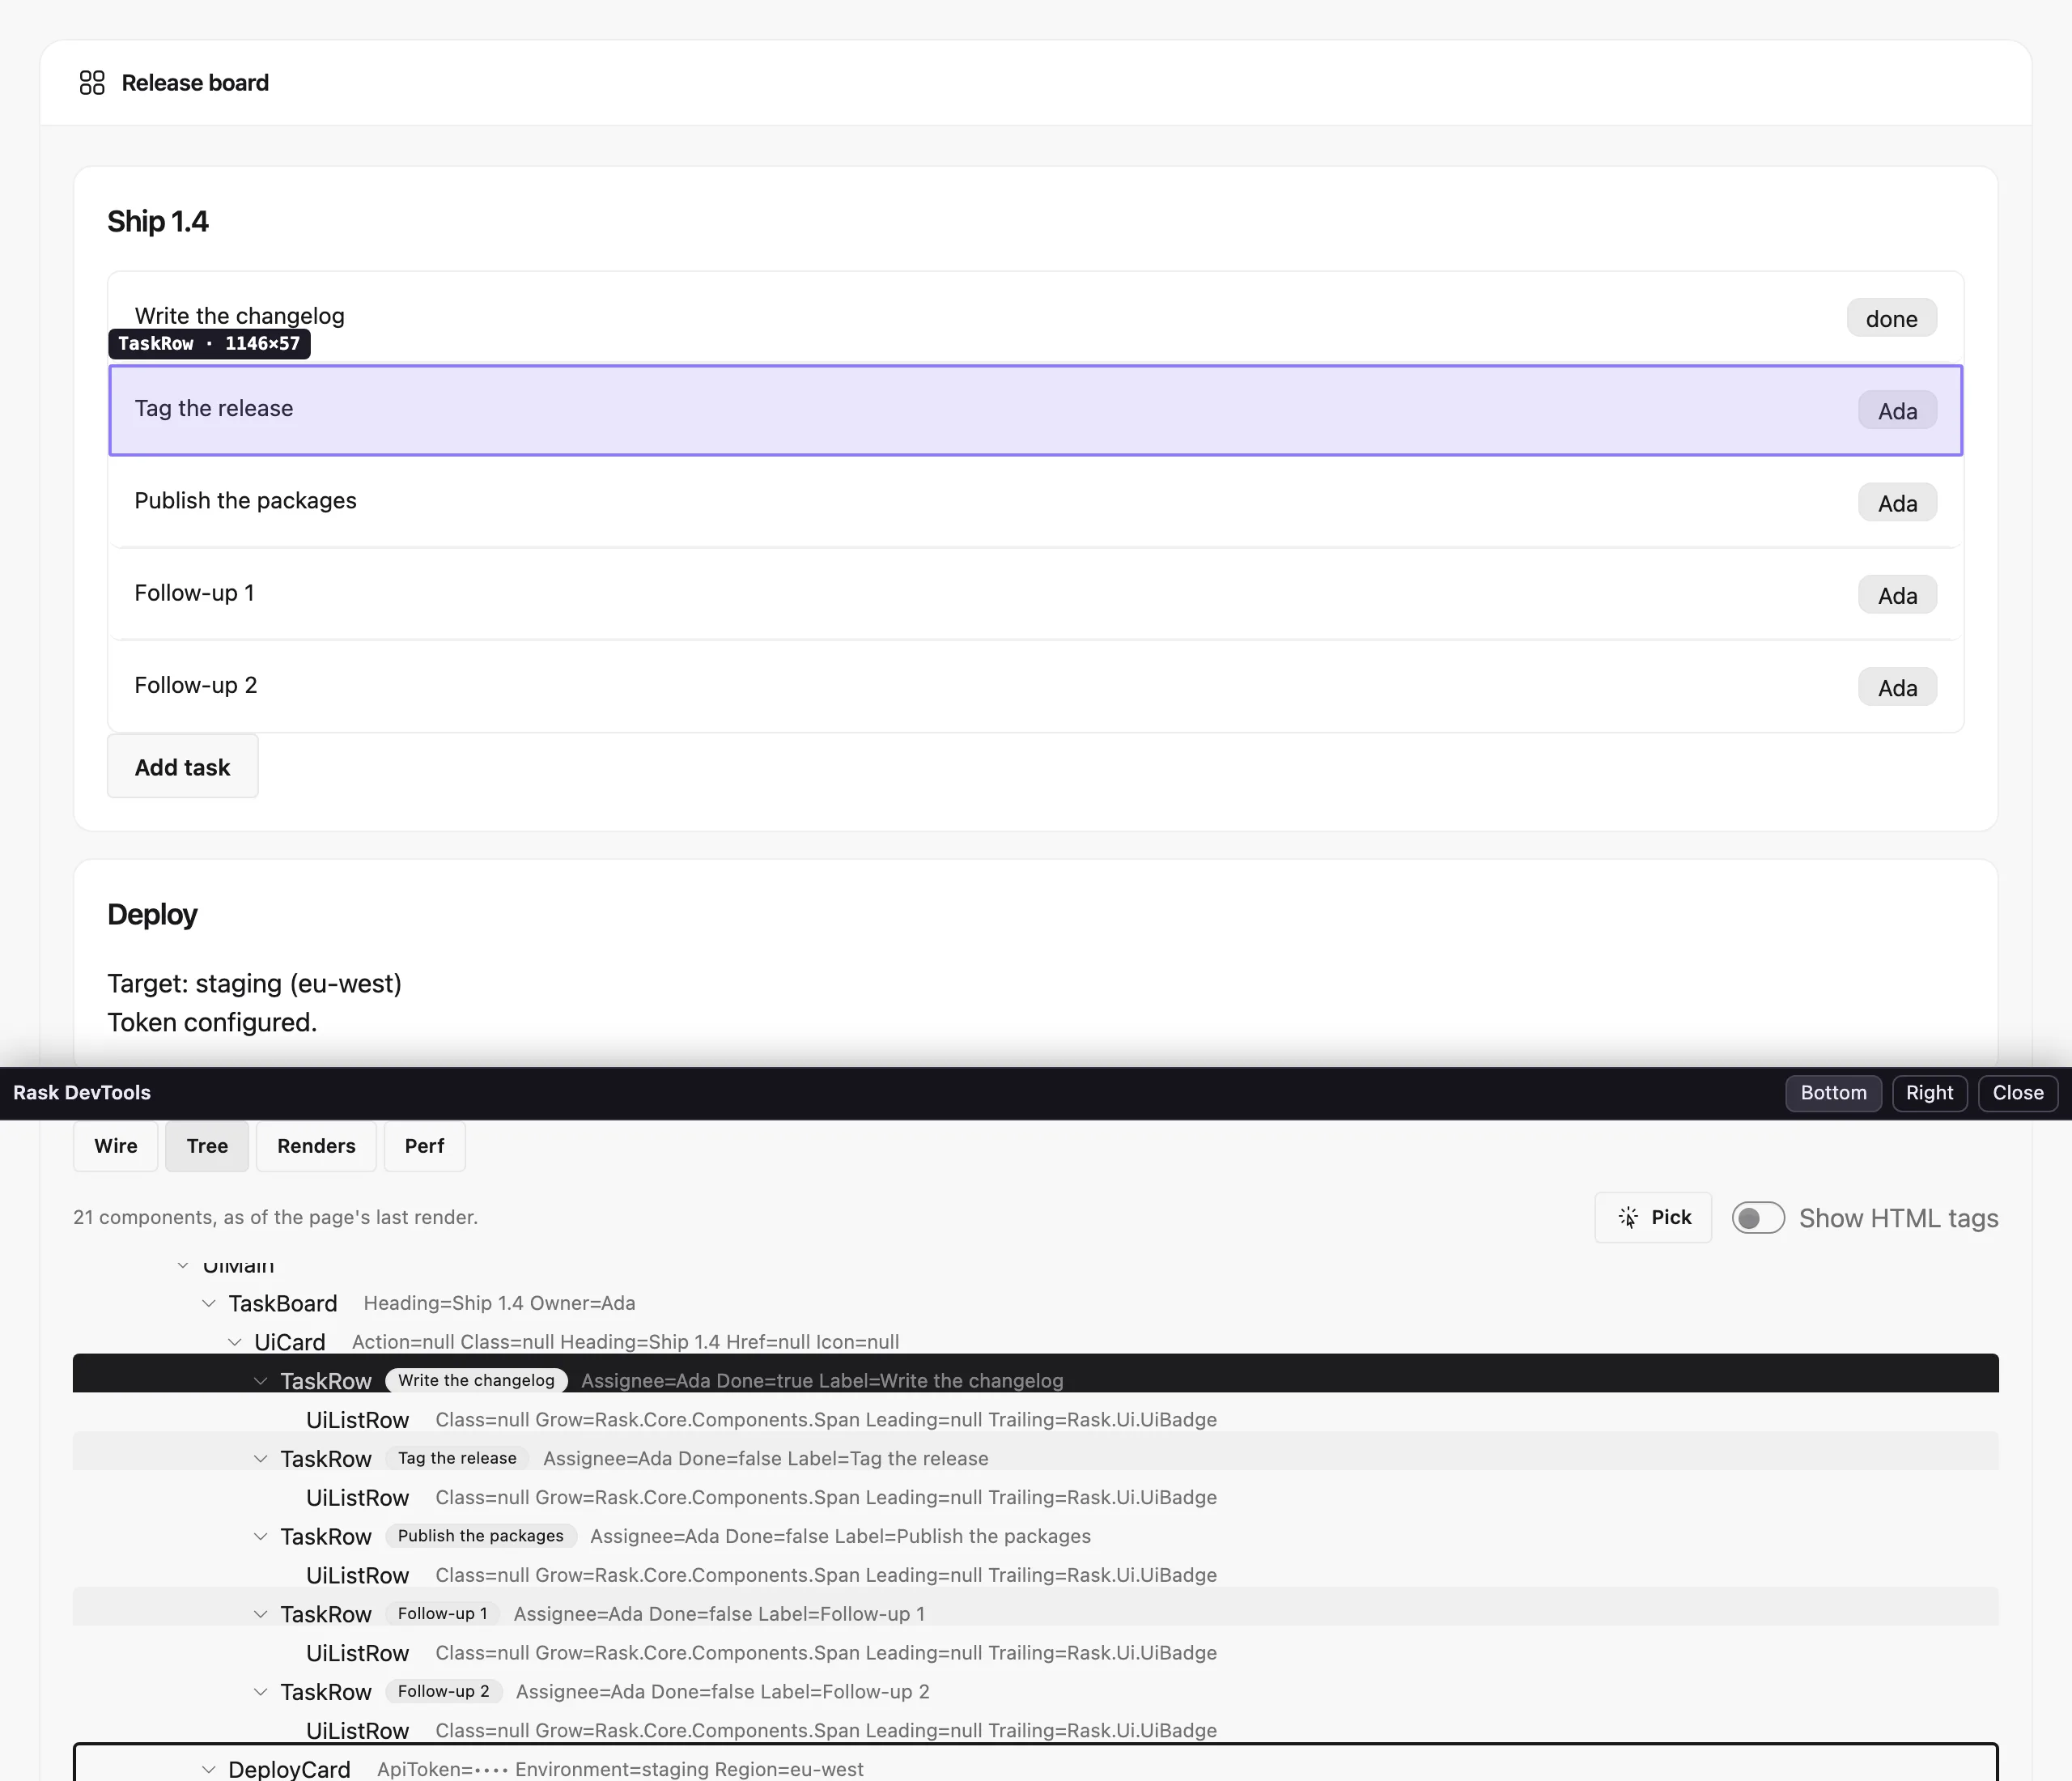
Pick goes the other way. Press it, point at anything on the page, and the same box follows the pointer. Click, and the tree opens to the component that rendered it and selects its row. The click goes to the devtools, not to your app. Press Esc, or Pick again, to stop without choosing.
A pick lands on the nearest component. Some kit components, UiButton among them, render an element directly and
don't appear in the tree themselves, so pointing at a button picks the component the button sits in. With Show
HTML tags on, a pick lands on the element itself.
Secrets stay out of it
A prop that looks sensitive is never read. It shows as •••• instead. The decision is made when the app is built, so
the value never reaches the panel. A prop is treated as sensitive when:
- its name contains
password,passcode,secret,token,apikeyorcredential, or is exactlypinorssn; - or it carries
[DataType(DataType.Password)],[PasswordPropertyText],[PersonalData]or[ProtectedPersonalData].
Add one of those attributes to a prop whose name does not give it away.
Renders
Renders counts the components whose Render() ran. A component that Rask served from its render cache did no
work, so it isn't counted. What's left is the list to read when a page feels slow: a component near the top that you
didn't expect to render on every click is the one to look at.
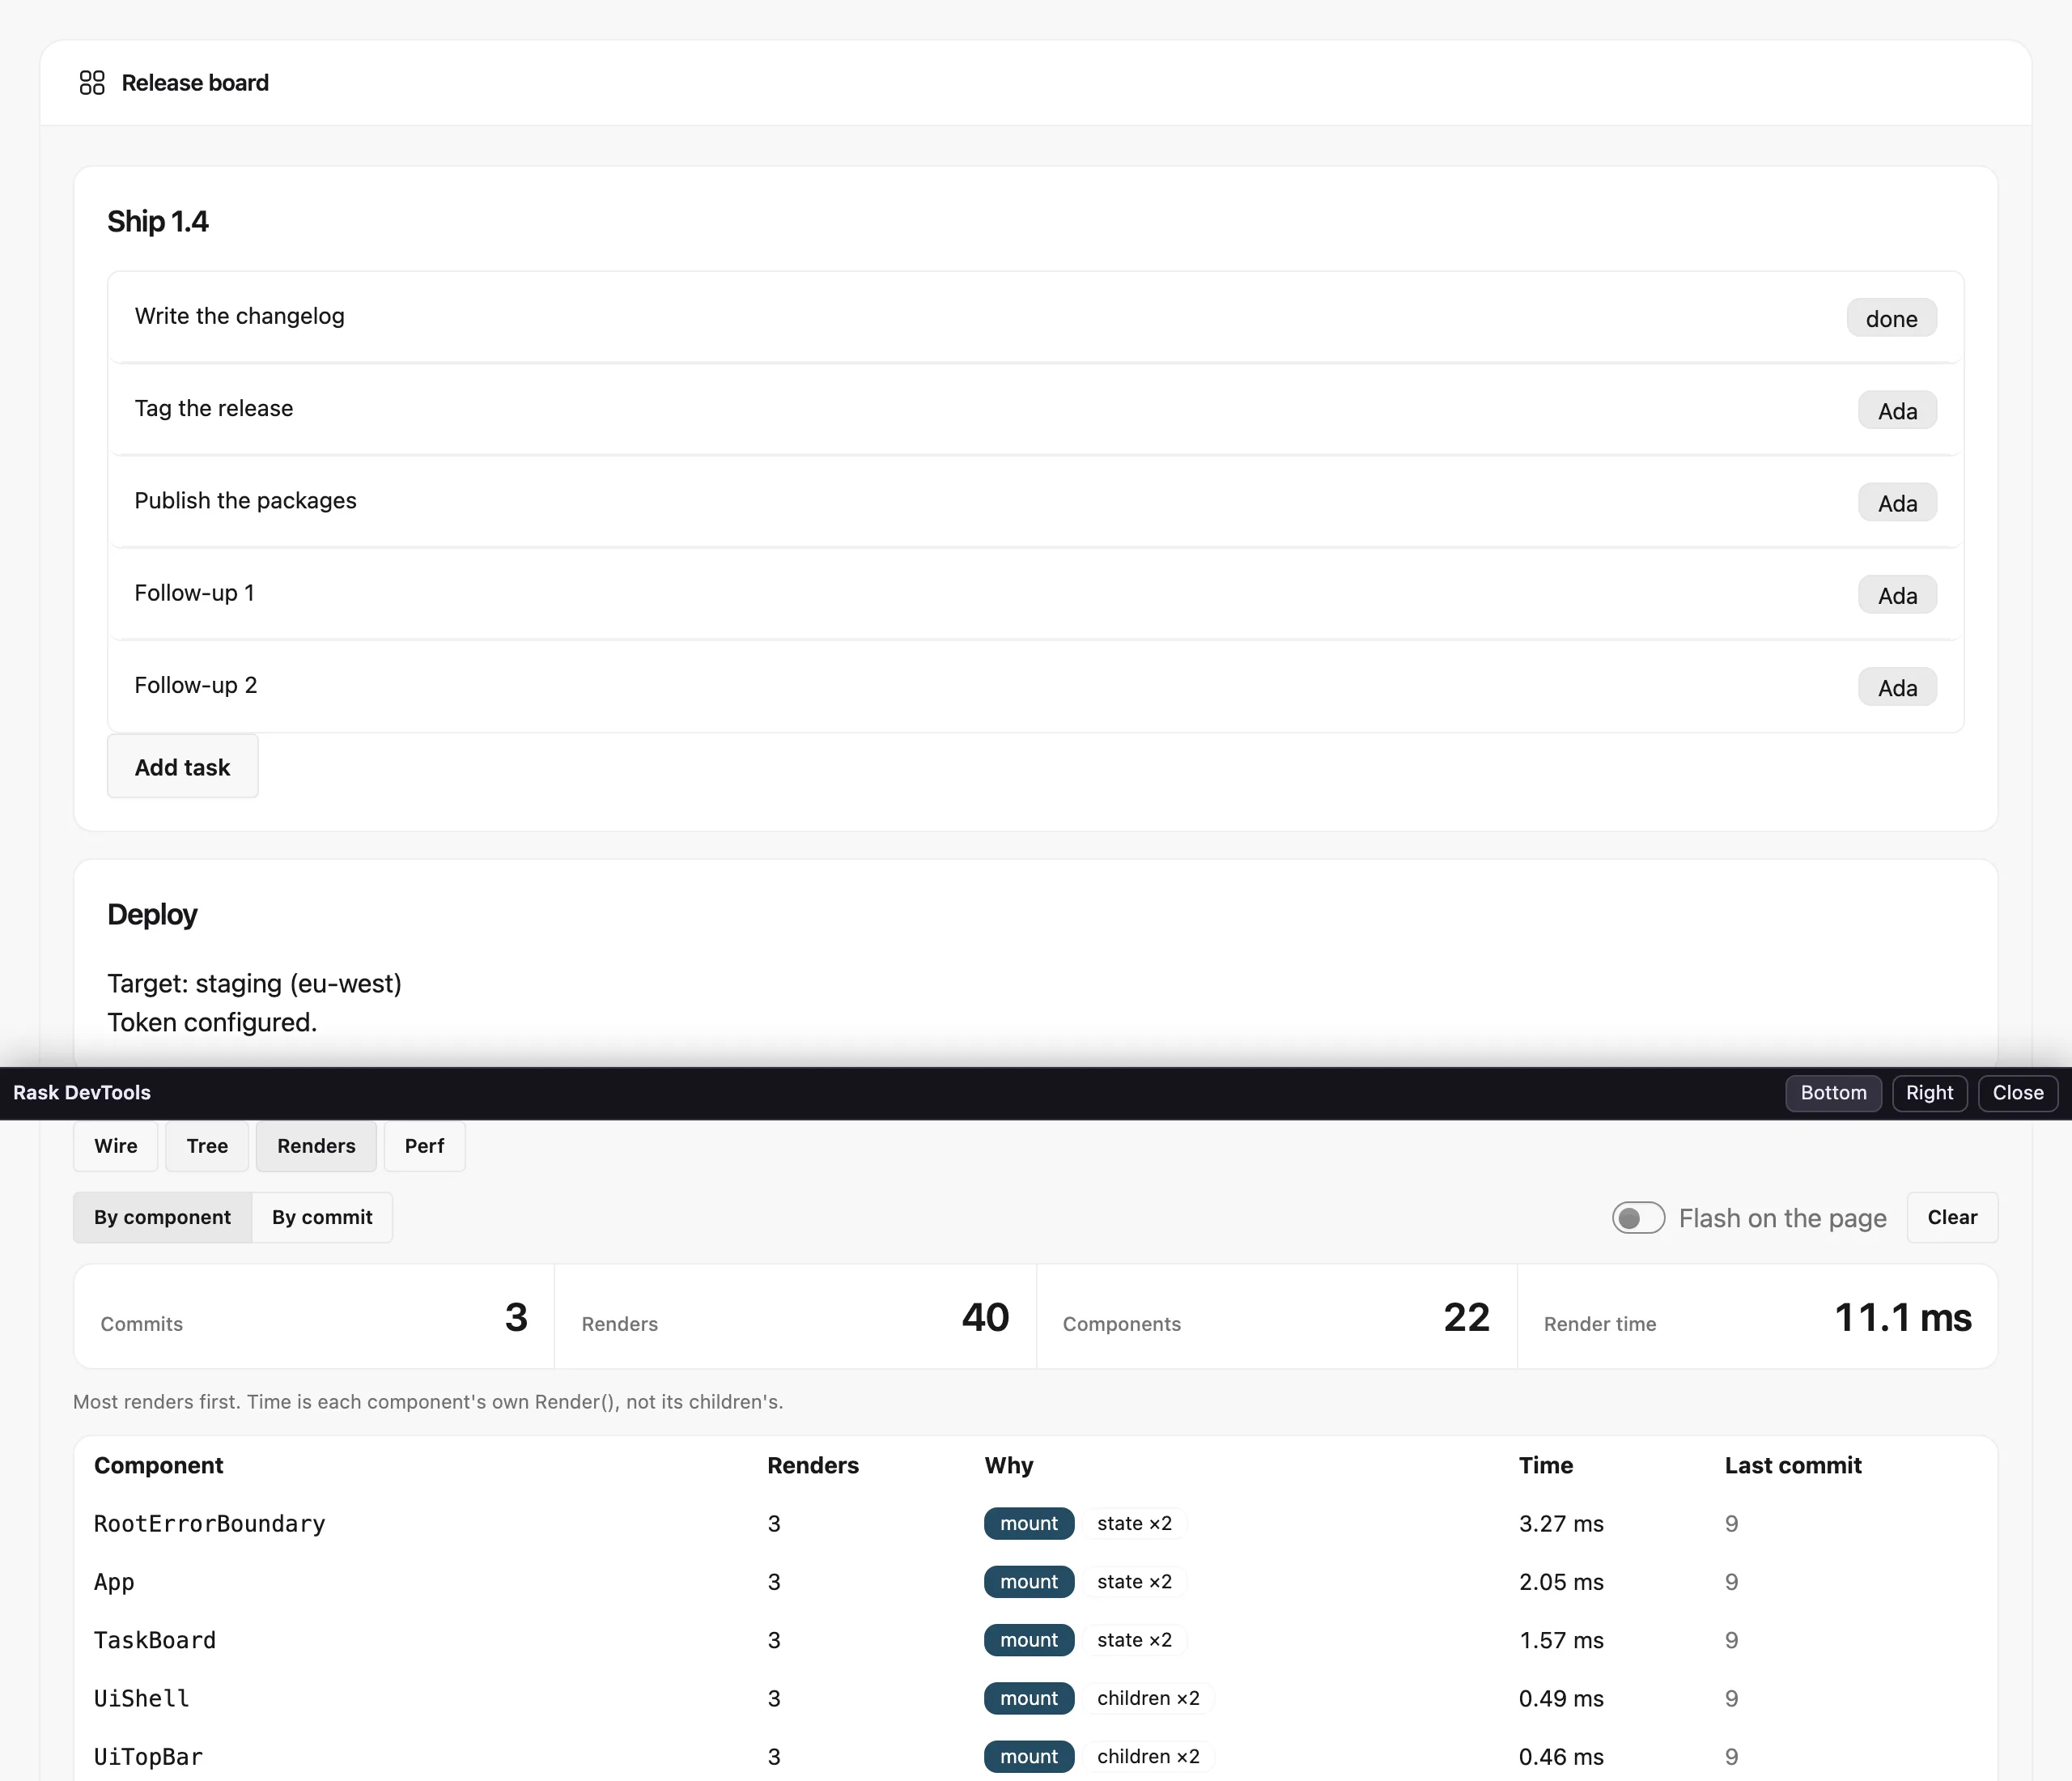
By component totals each component instance, most renders first:
- Renders: how many times its
Render()ran. - Why: each reason it rendered, with a count.
- Time: how long its own
Render()took, added up. Its children aren't included; they render after it returns. - Last commit: the number of the last commit it rendered in.
By commit lists the renders the page committed, newest first. Each row shows how many of the page's components
rendered, which ones, and why, with repeats folded together: TaskRow ×3 rather than three rows.
A reason is one of these:
| Reason | Why the component rendered |
|---|---|
mount |
Its first render. |
props |
Its parent passed props that changed. |
state |
StateHasChanged, or one of its own handlers ran. |
bypass cache |
It overrides BypassRenderCache, so it renders whenever its parent does. |
context |
It read context or the culture, so it renders whenever its parent does. |
children |
It takes children, so it renders whenever its parent does. |
uncached |
Nothing marked it, and it had no cached render: it renders nothing, or its output was reused. |
The tab holds the last 200 commits, or 5,000 renders if that comes first, so its totals cover the page's recent past. Clear starts them again from nothing.
Flashing renders on the page
Turn on Flash on the page and the page shows each render as it happens, in two colours:
- Amber boxes a component that rendered, labelled with its name and why:
TaskRow · props. - Teal boxes a part of the page that the update actually changed.
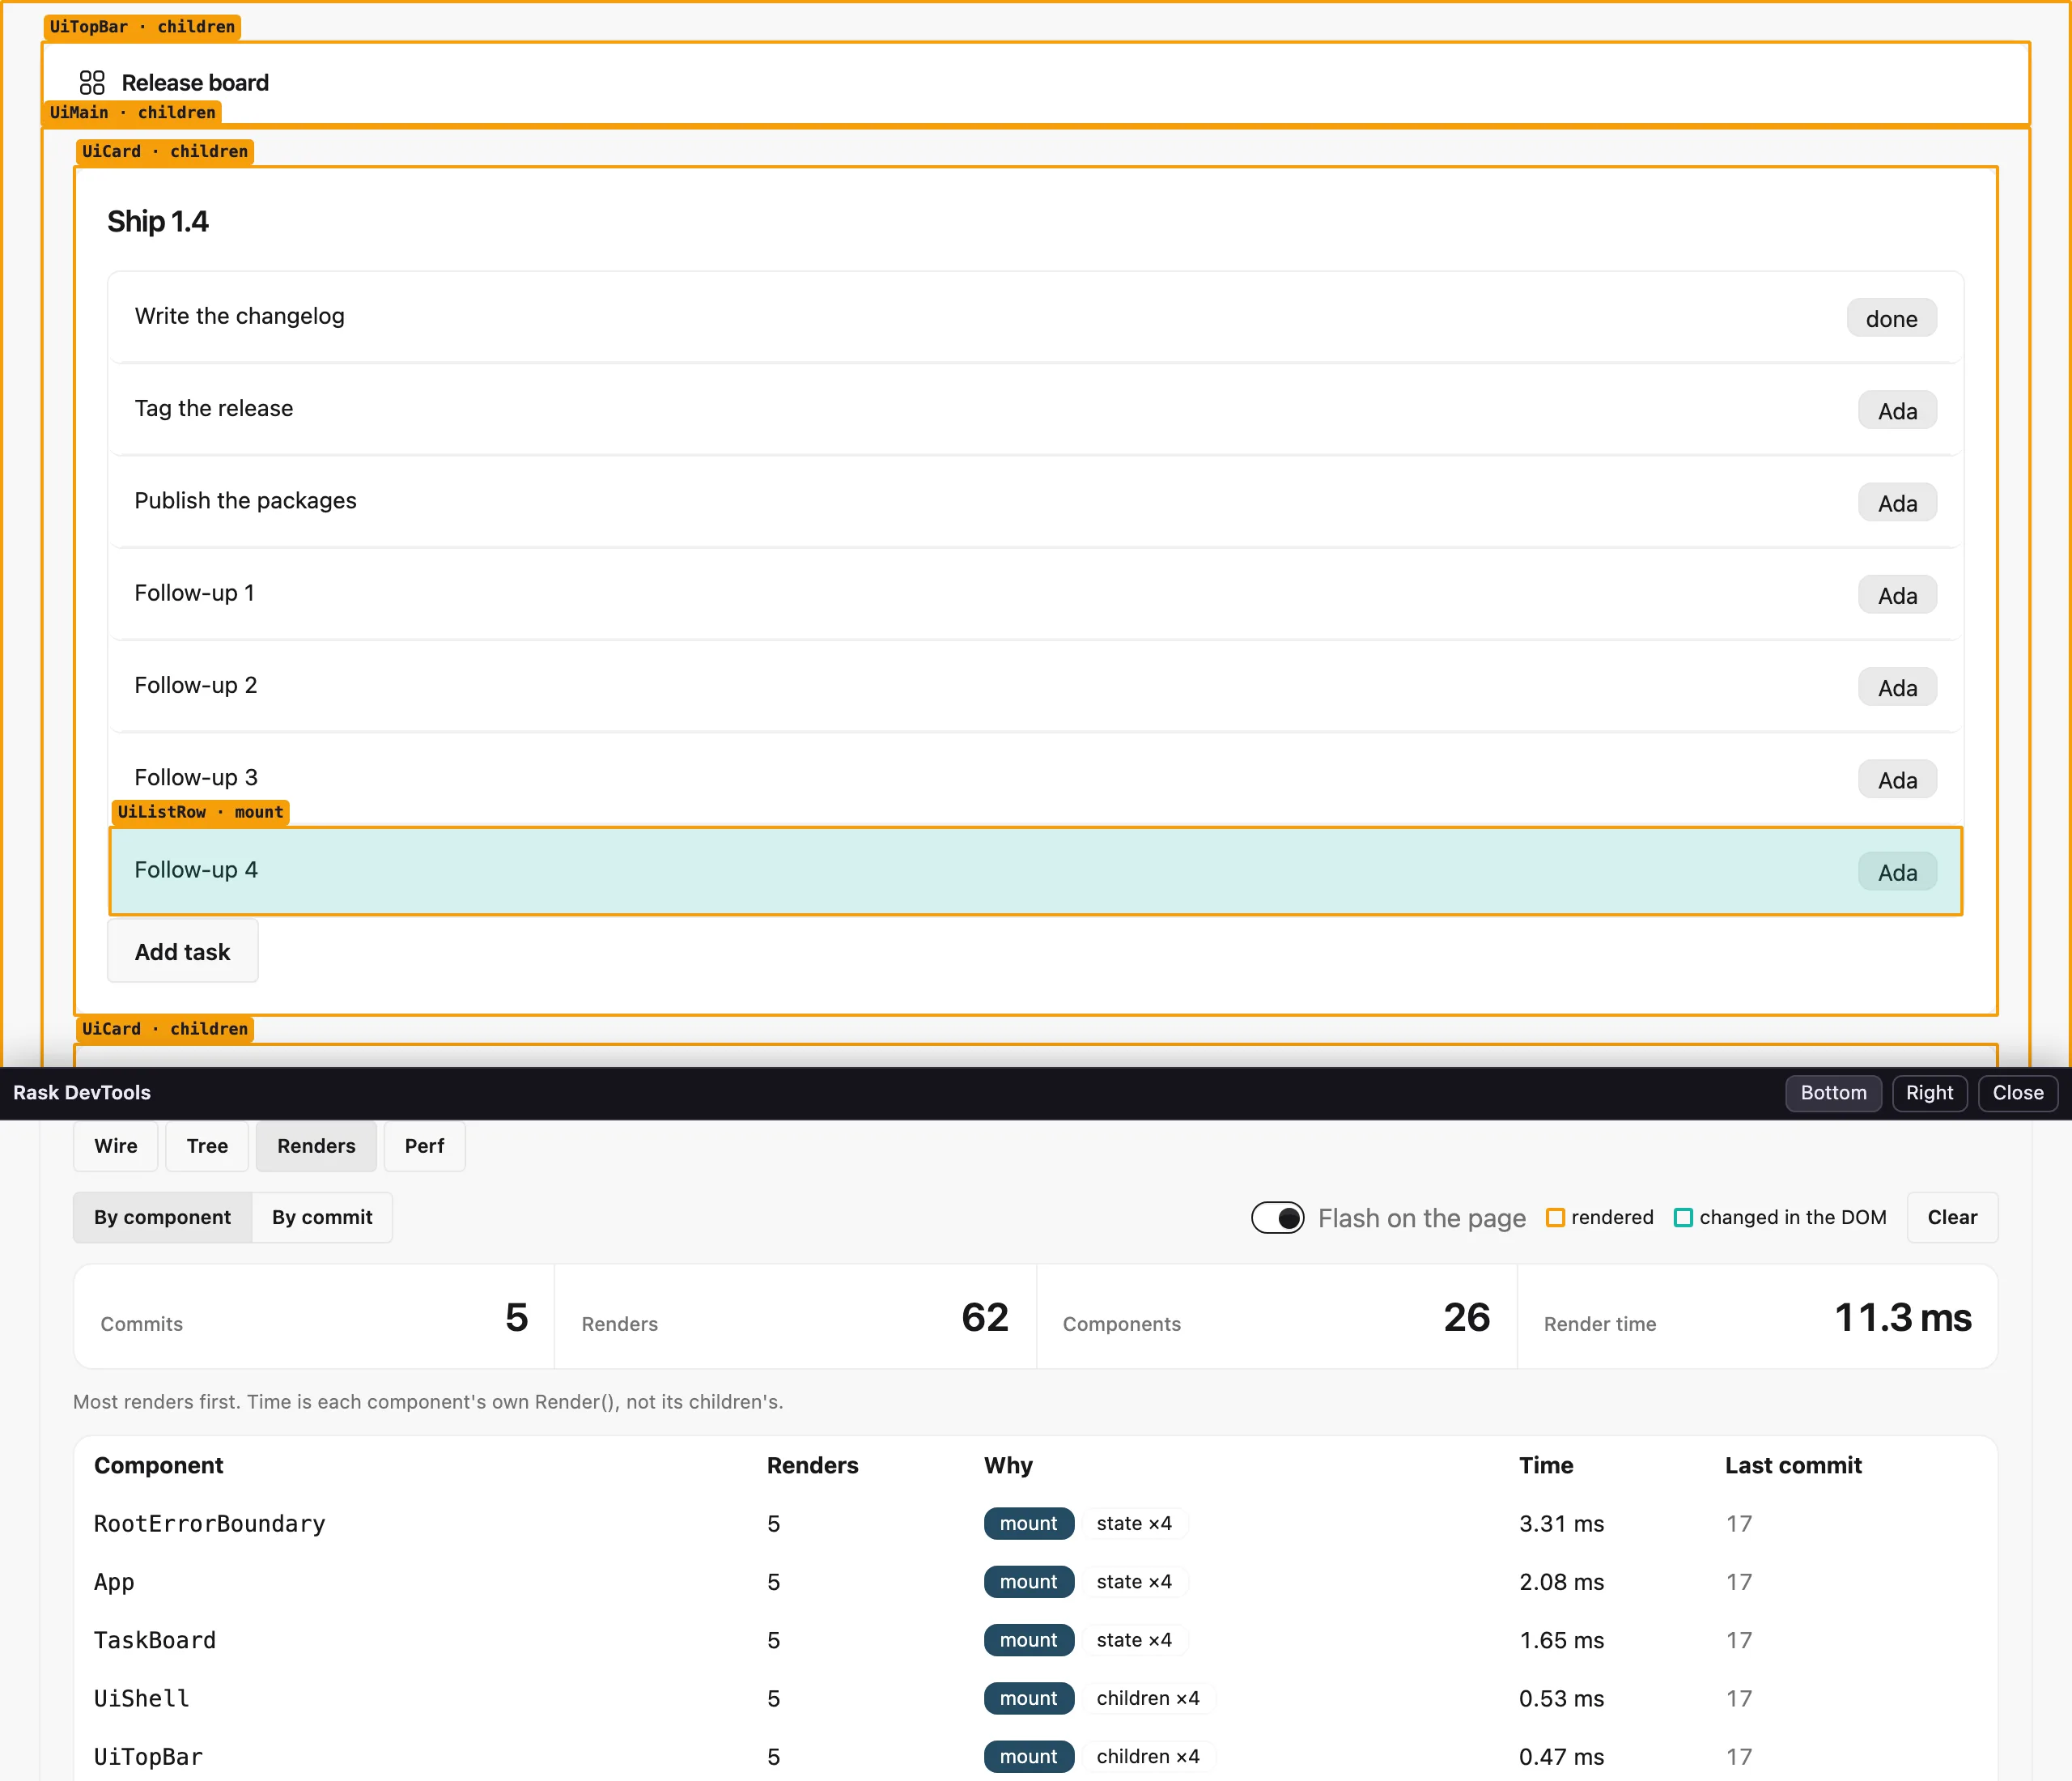
The two differ exactly where it matters. An amber box with no teal inside it is a component that rendered and changed nothing on the page: work you can often avoid.
Flashing keeps going while the drawer is closed, and the page remembers the switch. After a reload it flashes straight away: the panel loads behind the closed drawer to report what rendered. Turn the switch off to stop.
Teal boxes appear as soon as the page updates. Amber boxes come from the panel, a moment later.
Perf
Perf times each interaction from the event to the updated page. A click whose handler renders the page is one
row. So is a navigation. A render that nothing on the page asked for, such as a timer or a push, gets a row named
render.
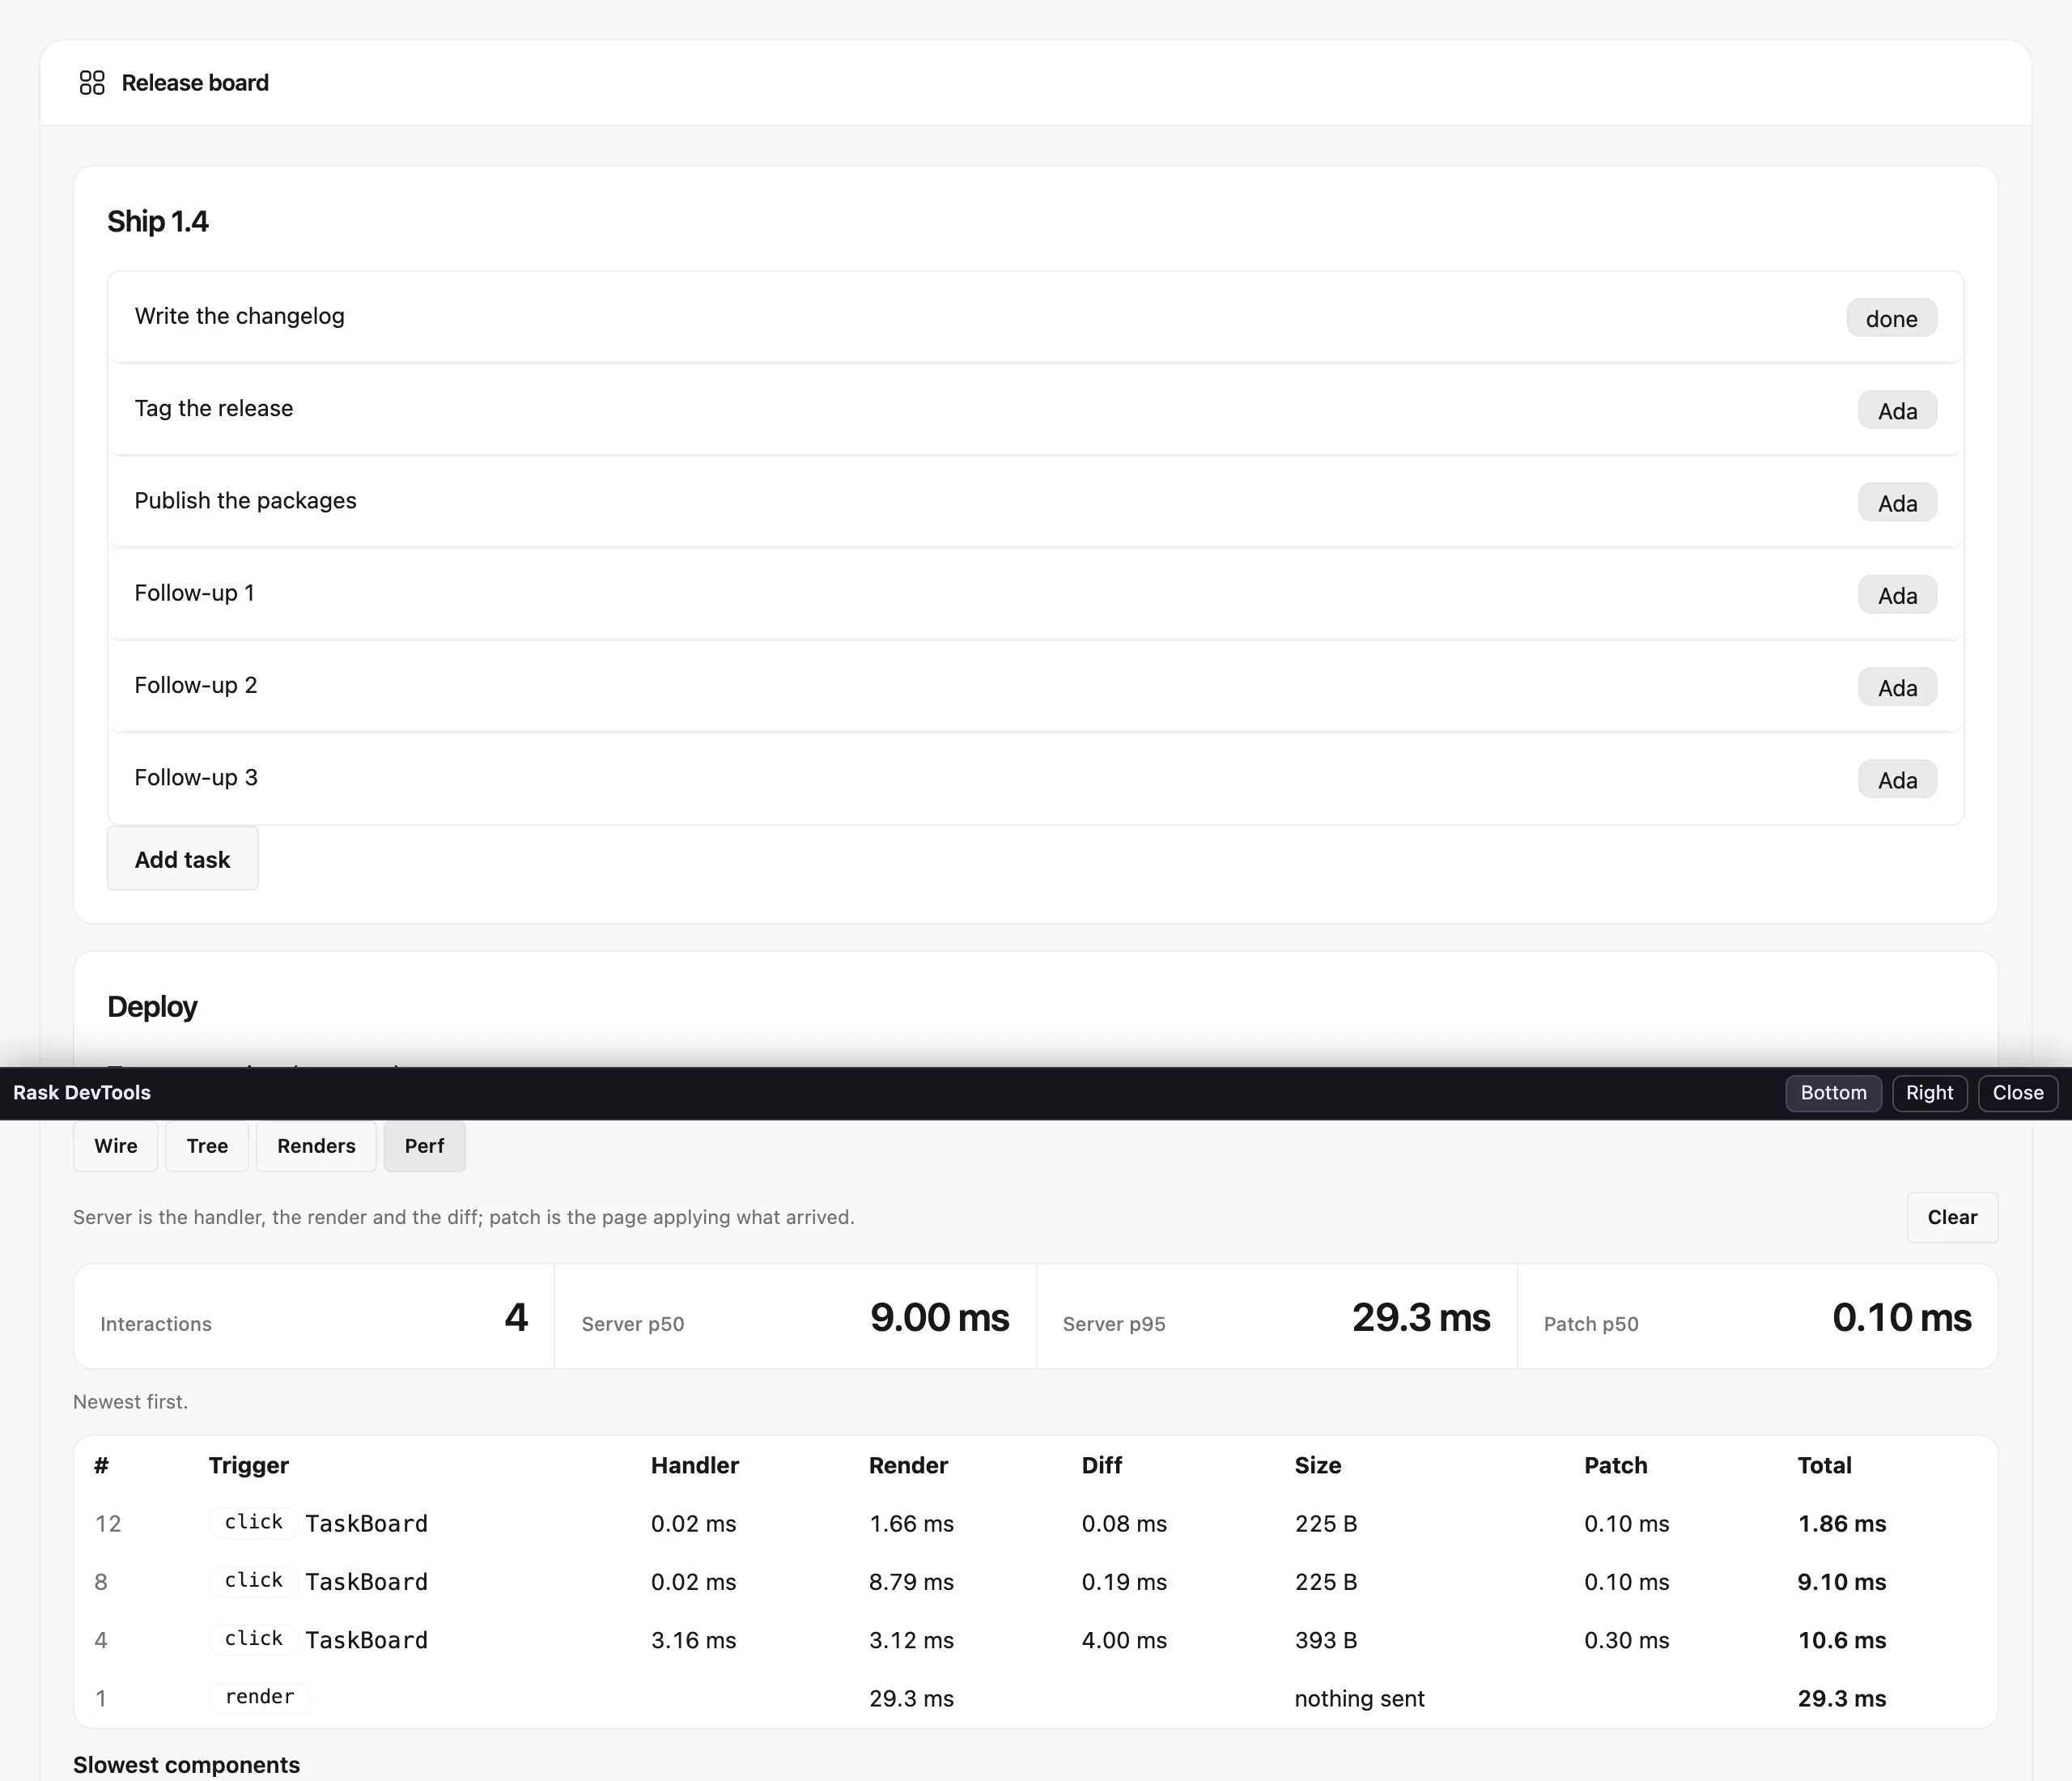
Each row shows:
- Trigger: the page event and the component whose handler ran, such as
click TaskBoard. A handler that threw says so. - Handler: the handler's own time. A render it asks for while it awaits counts under Render, not here.
- Render: the render walks the interaction caused.
- Diff: working out what to send to the page.
- Size: the frames sent, on the wire. Nothing sent means the render changed nothing. It also marks the page's first render, which arrives as the HTML page rather than as a frame.
- Patch: how long the page took to apply the frames. The page measures this itself, so it appears a moment after the row. A frame the page applied before the panel was open has no patch time.
- Total: all of the above.
The totals on top are the median (p50) and 95th-percentile (p95) server time, and the median patch time.
Slowest components lists the components that spent the most time in their own Render(), with how often they
rendered, their average and their slowest render. It covers the same recent commits as the Renders tab.
The tab keeps the last 500 interactions. Clear forgets them.